Initial Access
If you've just completed a Deployment, it's time to really get into things by accessing the primary user interfaces in the project.
Getting Status
First, let's make sure everything is up and running. Let's fire stationctl back up and use the "Status" menu:
- Run the CLI: $
./stationctl - Select option 3: "
show current deployment"
This will run through a check of you new Vagrant boxes to see if they're up and communicating over all the necessary channels.
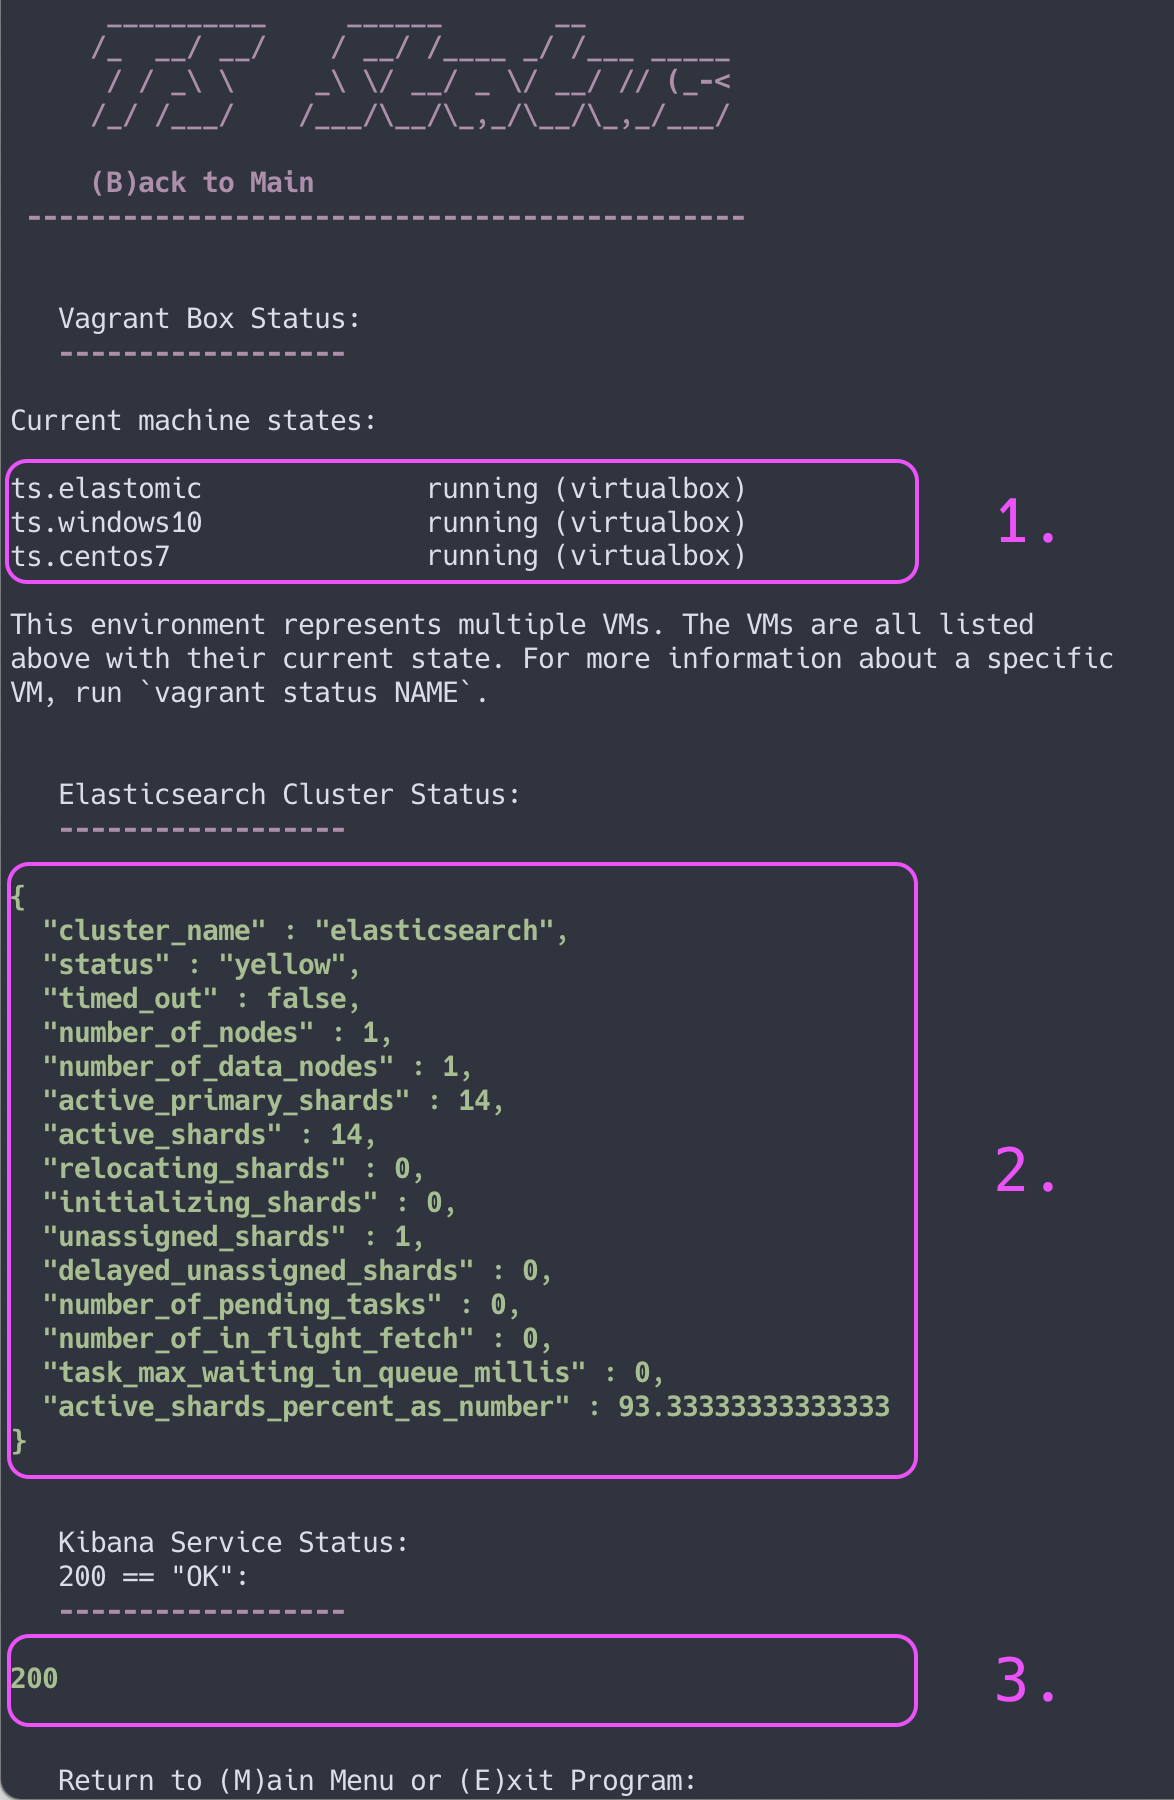
This provides some very valuable information on the status of our local range:
- Virtualbox machine state
- Elasticsearch API availability
- Kibana web interface availability
Note: Because Elasticsearch is a single node installation, the status will show "yellow". Everything is fine.
Interface Login
The environment is designed for users to interact with 2 primary interfaces:
- Atomic Redteam - execute threats
- Kibana WebUI - detect threats
Atomic Red Team
This adversary emulation toolset is accessed by ssh'ing into the ts.elastomic box and starting up a powershell session.
- From the vagrant/ directory:
- $
vagrant ssh ts.elastomic
- $
- Start a powershell session:
- $
pwsh
- $
Kibana Web Interface
- To reach Kibana browse to
localhost:5601 -
Login with the credentials:
- user:
vagrant - pass:
vagrant
- user:
-
Once in Kibana click the hamburger menu in the upper left corner of the UI and select the "Discover" tab.
Now that you've set up the primary user interfaces, it's time to move on to running a functions check!